> ## Documentation Index
> Fetch the complete documentation index at: https://pricepirate.com/docs/llms.txt
> Use this file to discover all available pages before exploring further.
# Product metrics
> Read prices, ranks, and price stability per product over a selectable time window.
Product metrics show one row per tracked product with its prices, ranks, and price stability on the marketplace. Every value comes from the **measurements** that PricePirate records regularly for the connected [listing](/docs/en/guide/concepts/listings-and-offers). Each [synchronization](/docs/en/guide/automation/syncs) creates a new measurement with all offers visible in it.
You find the metrics on the **Products** page in the **Metrics** tab. While [reports](/docs/en/guide/reports/overview) summarize the whole marketplace, product metrics show exactly one row per product.
 ## Filters and controls
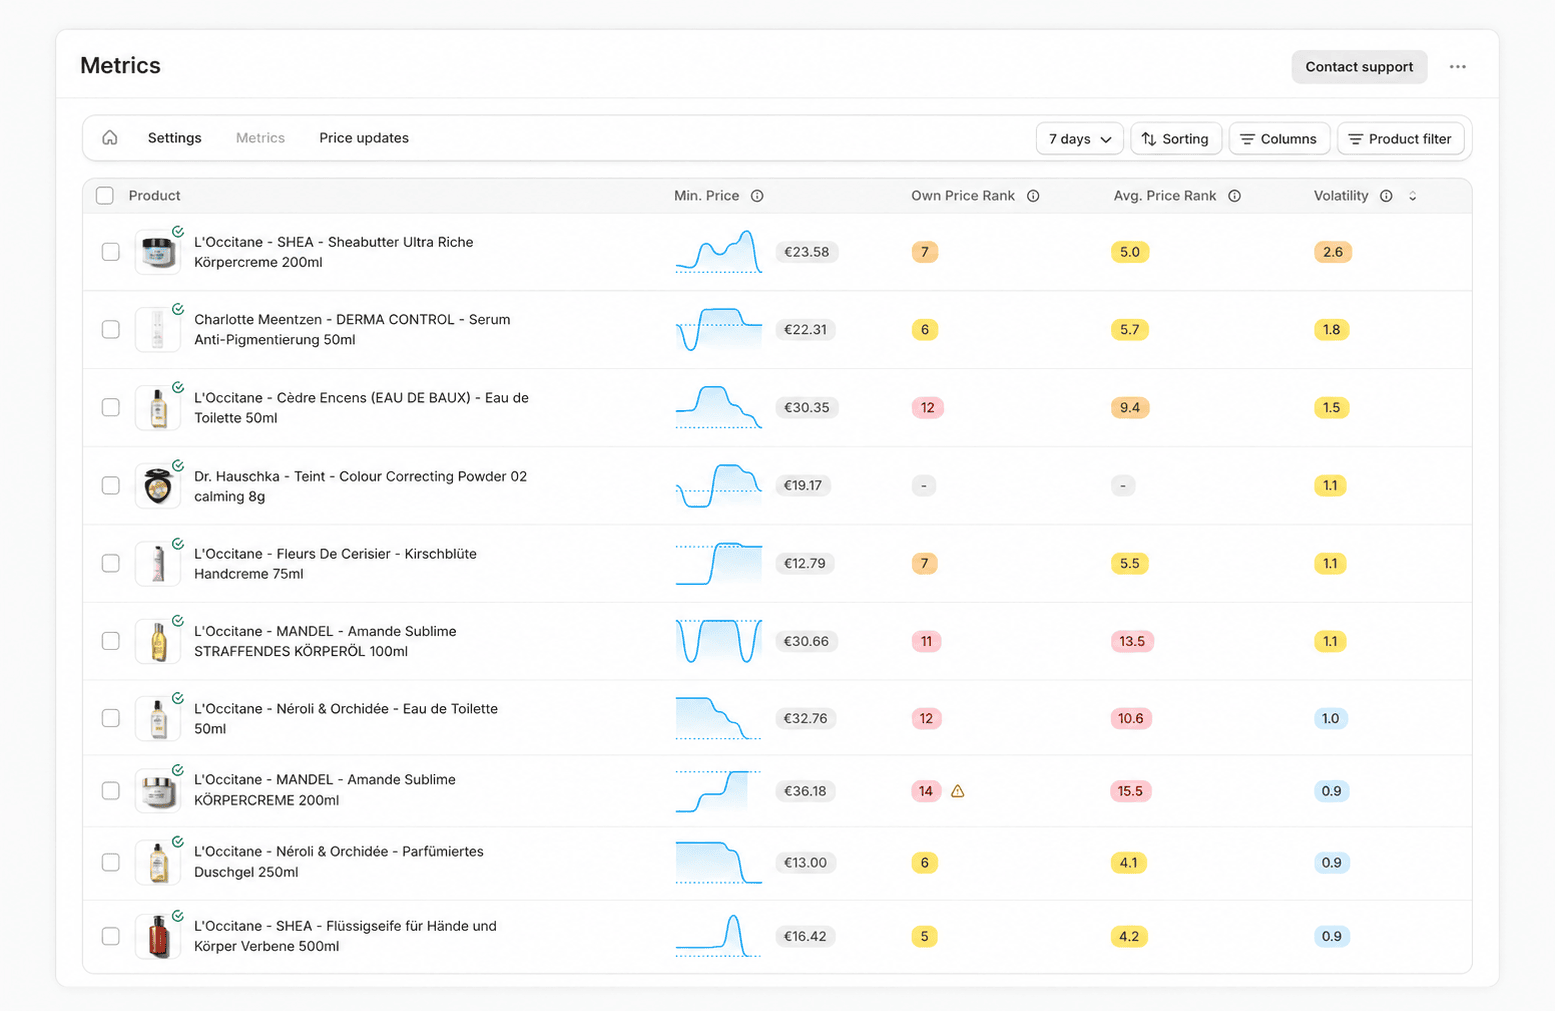
The header of the **Metrics** tab controls which data the table shows. Every control takes effect on the whole table immediately.
**Time window** switches between **7 days**, **14 days**, and **30 days**. The default is **7 days**. All averages, shares, sparklines, and the volatility respect this window.
**Marketplace** appears only when more than one marketplace is configured. The default is the marketplace you set for price changes in the settings. Read more under **Markets** in [Settings](/docs/en/guide/account/settings).
**Sorting** opens a menu with **Sort by** (column) and **Order** (**Ascending** or **Descending**). The default is **Avg. Own Price Rank** ascending. Clicking a column header also sorts by that column.
**Columns** shows or hides individual metric columns. Only **Min. Price without Shipping**, **Own Price Rank**, **Avg. Own Price Rank**, and **Price Volatility** are visible by default; show any other column here.
**Product filter** restricts the table to selected products or a collection. Active filters appear as removable chips above the table, along with a button that removes all filters at once.
## The columns
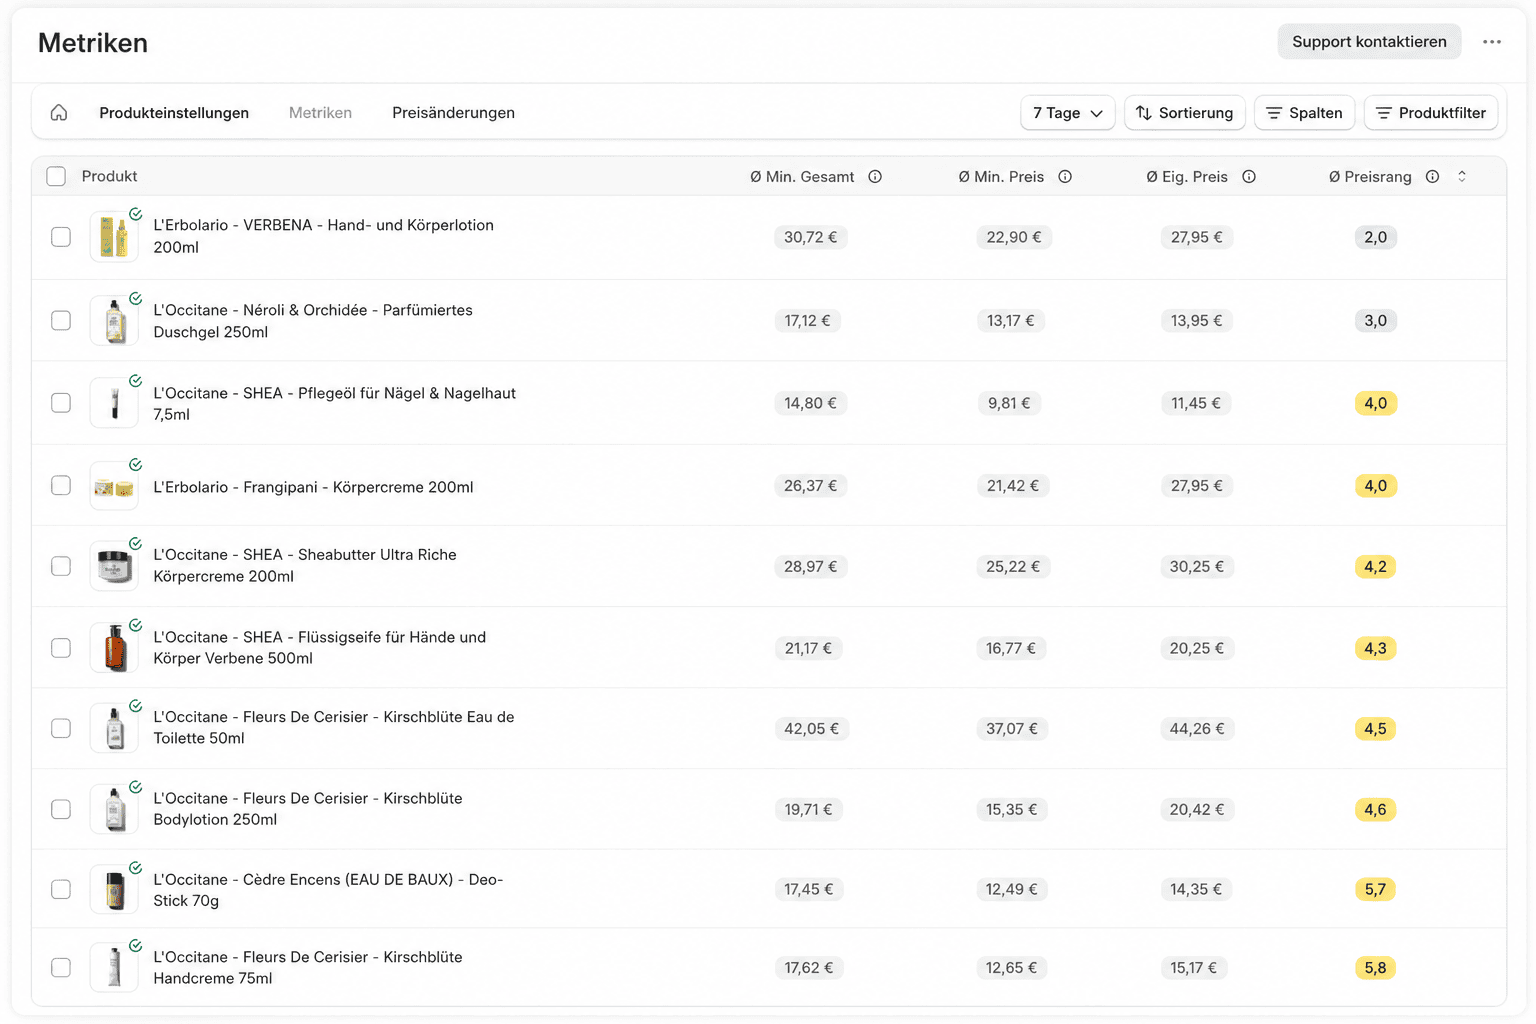
Each row stands for a tracked product. The four price columns also show a **sparkline** with the trend over the selected window; the value next to it is a chip that opens the [detail view](/docs/en/guide/insights/metrics-details) at the matching chart. “Current” always means the most recent measurement in the window, while average values are averaged across all measurements in the window.
## Filters and controls
The header of the **Metrics** tab controls which data the table shows. Every control takes effect on the whole table immediately.
**Time window** switches between **7 days**, **14 days**, and **30 days**. The default is **7 days**. All averages, shares, sparklines, and the volatility respect this window.
**Marketplace** appears only when more than one marketplace is configured. The default is the marketplace you set for price changes in the settings. Read more under **Markets** in [Settings](/docs/en/guide/account/settings).
**Sorting** opens a menu with **Sort by** (column) and **Order** (**Ascending** or **Descending**). The default is **Avg. Own Price Rank** ascending. Clicking a column header also sorts by that column.
**Columns** shows or hides individual metric columns. Only **Min. Price without Shipping**, **Own Price Rank**, **Avg. Own Price Rank**, and **Price Volatility** are visible by default; show any other column here.
**Product filter** restricts the table to selected products or a collection. Active filters appear as removable chips above the table, along with a button that removes all filters at once.
## The columns
Each row stands for a tracked product. The four price columns also show a **sparkline** with the trend over the selected window; the value next to it is a chip that opens the [detail view](/docs/en/guide/insights/metrics-details) at the matching chart. “Current” always means the most recent measurement in the window, while average values are averaged across all measurements in the window.
 | Column | Meaning |
| ------------------------------- | ---------------------------------------------------------------------------------------------------------------------------------------------------------------------------------------------------------------- |
| **Min. Total Price** | Cheapest total price including shipping among all offers, from the most recent measurement. |
| **Min. Price without Shipping** | Cheapest product price without shipping among all offers, from the most recent measurement. |
| **Own Total Price** | Total price of your own offer including shipping, from the most recent measurement. |
| **Own Price** | Product price of your own offer without shipping, from the most recent measurement. |
| **Avg. Min. Total Price** | Average of the cheapest total price across all measurements in the window. |
| **Avg. Min. Price** | Average of the cheapest product price across all measurements in the window. |
| **Avg. Own Total Price** | Average of your own total price across all measurements in the window. |
| **Avg. Own Price** | Average of your own product price across all measurements in the window. |
| **Own Price Rank** | Rank of your offer by product price, counting each vendor only once, from the most recent measurement. Lower is better. |
| **Own Total Rank** | Rank of your offer by total price including shipping, counting each vendor only once, from the most recent measurement. Lower is better. |
| **Avg. Own Price Rank** | Average own rank by product price in the selected window. Lower is better. |
| **Avg. Own Total Rank** | Average own rank by total price including shipping in the selected window. Lower is better. |
| **Cheapest by Price** | Share of measurements in the window where your offer was the cheapest by product price. Higher is better. |
| **Cheapest by Total** | Share of measurements in the window where your offer was the cheapest by total price. Higher is better. |
| **Price Volatility** | Estimated number of daily price changes of the cheapest offer in the window, corrected for how often this listing is sampled. Unit: **/day**. Read more under [Price volatility](/docs/en/guide/insights/volatility). |
| **Last Synchronization** | Time of the most recent measurement of this listing. |
The columns without shipping show the plain product price, the total columns show the [total price including shipping](/docs/en/guide/concepts/total-price). Compare both when shipping matters on the marketplace.
The colored badges signal the situation at a glance from green (good) to red (critical): lower ranks and higher cheapest shares are better. **Price Volatility** has no good-or-bad color – it only shows how restless the cheapest price of the listing is. A **-** means there is no data for this product and window, for example because there is no own offer or no measurement yet. When the most recent measurement is more than a day old, a warning icon appears next to **Own Price Rank** and **Own Total Rank** indicating that the data might be outdated.
Persistently high or rising ranks are a signal to review the product's [pricing strategy](/docs/en/guide/pricing/strategies) and its [minimum price](/docs/en/guide/pricing/settings). High [price volatility](/docs/en/guide/insights/volatility) marks listings with a lot of price movement – good candidates for more [synchronizations](/docs/en/guide/automation/syncs) and for [auto-applying price changes](/docs/en/guide/price-changes/auto-apply). When a pattern shows across many products, look at it for the whole marketplace through the [reports](/docs/en/guide/reports/overview).
## Open the detail view
Select a single row and click **Show details** to open that product's price and rank history. It is faster to click a price chip: it jumps straight to the [detail view](/docs/en/guide/insights/metrics-details) at the matching chart (price or total price). The **Navigation** menu in the selection bar also moves to the [product settings](/docs/en/guide/catalog/product-settings) or [price changes](/docs/en/guide/price-changes/review) for the selected product.
As long as you track no products yet, the table stays empty. Connect your Shopify catalog to listings to monitor competitor pricing – read more under [Add products](/docs/en/guide/catalog/add-products). For the bigger picture of what price monitoring delivers, see the solution page [Price monitoring](/docs/en/solutions/price-monitoring).
| Column | Meaning |
| ------------------------------- | ---------------------------------------------------------------------------------------------------------------------------------------------------------------------------------------------------------------- |
| **Min. Total Price** | Cheapest total price including shipping among all offers, from the most recent measurement. |
| **Min. Price without Shipping** | Cheapest product price without shipping among all offers, from the most recent measurement. |
| **Own Total Price** | Total price of your own offer including shipping, from the most recent measurement. |
| **Own Price** | Product price of your own offer without shipping, from the most recent measurement. |
| **Avg. Min. Total Price** | Average of the cheapest total price across all measurements in the window. |
| **Avg. Min. Price** | Average of the cheapest product price across all measurements in the window. |
| **Avg. Own Total Price** | Average of your own total price across all measurements in the window. |
| **Avg. Own Price** | Average of your own product price across all measurements in the window. |
| **Own Price Rank** | Rank of your offer by product price, counting each vendor only once, from the most recent measurement. Lower is better. |
| **Own Total Rank** | Rank of your offer by total price including shipping, counting each vendor only once, from the most recent measurement. Lower is better. |
| **Avg. Own Price Rank** | Average own rank by product price in the selected window. Lower is better. |
| **Avg. Own Total Rank** | Average own rank by total price including shipping in the selected window. Lower is better. |
| **Cheapest by Price** | Share of measurements in the window where your offer was the cheapest by product price. Higher is better. |
| **Cheapest by Total** | Share of measurements in the window where your offer was the cheapest by total price. Higher is better. |
| **Price Volatility** | Estimated number of daily price changes of the cheapest offer in the window, corrected for how often this listing is sampled. Unit: **/day**. Read more under [Price volatility](/docs/en/guide/insights/volatility). |
| **Last Synchronization** | Time of the most recent measurement of this listing. |
The columns without shipping show the plain product price, the total columns show the [total price including shipping](/docs/en/guide/concepts/total-price). Compare both when shipping matters on the marketplace.
The colored badges signal the situation at a glance from green (good) to red (critical): lower ranks and higher cheapest shares are better. **Price Volatility** has no good-or-bad color – it only shows how restless the cheapest price of the listing is. A **-** means there is no data for this product and window, for example because there is no own offer or no measurement yet. When the most recent measurement is more than a day old, a warning icon appears next to **Own Price Rank** and **Own Total Rank** indicating that the data might be outdated.
Persistently high or rising ranks are a signal to review the product's [pricing strategy](/docs/en/guide/pricing/strategies) and its [minimum price](/docs/en/guide/pricing/settings). High [price volatility](/docs/en/guide/insights/volatility) marks listings with a lot of price movement – good candidates for more [synchronizations](/docs/en/guide/automation/syncs) and for [auto-applying price changes](/docs/en/guide/price-changes/auto-apply). When a pattern shows across many products, look at it for the whole marketplace through the [reports](/docs/en/guide/reports/overview).
## Open the detail view
Select a single row and click **Show details** to open that product's price and rank history. It is faster to click a price chip: it jumps straight to the [detail view](/docs/en/guide/insights/metrics-details) at the matching chart (price or total price). The **Navigation** menu in the selection bar also moves to the [product settings](/docs/en/guide/catalog/product-settings) or [price changes](/docs/en/guide/price-changes/review) for the selected product.
As long as you track no products yet, the table stays empty. Connect your Shopify catalog to listings to monitor competitor pricing – read more under [Add products](/docs/en/guide/catalog/add-products). For the bigger picture of what price monitoring delivers, see the solution page [Price monitoring](/docs/en/solutions/price-monitoring).