> ## Documentation Index
> Fetch the complete documentation index at: https://pricepirate.com/docs/llms.txt
> Use this file to discover all available pages before exploring further.
# Activity
> How much the market moves: offers, average prices, price ranges, and volatility.
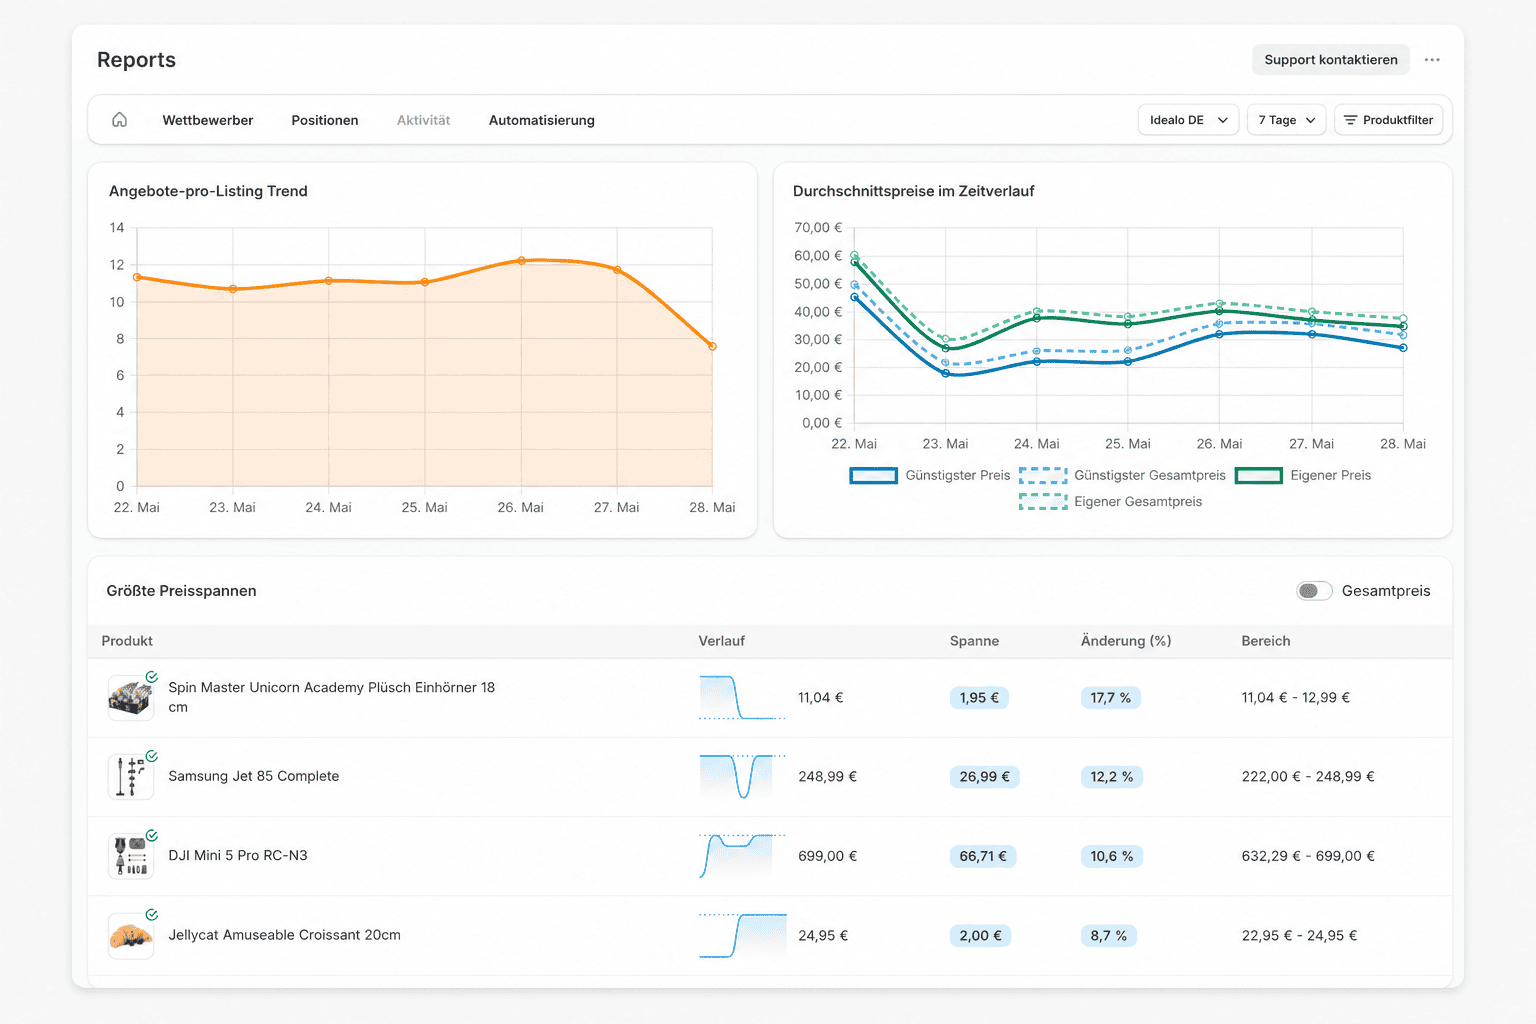
The **Activity** tab answers the question: how much does my market move? It shows how many offers appear on your listings, how average prices develop, and which products fluctuate the most.
 ## Offers-per-listing trend
The trend shows, per day, the average number of competitor offers per listing (**Avg. competitor offers**). For each measurement, PricePirate counts the offers from other shops and averages this number across all listings that day. A rising line means more sellers compete on your listings.
## Average prices over time
This chart shows four lines, each as a daily average across all listings:
| Line | Meaning |
| ------------------------ | ---------------------------------------------------------------------------------- |
| **Cheapest price** | Average cheapest product price excluding shipping. |
| **Cheapest total price** | Average cheapest [total price including shipping](/docs/en/guide/concepts/total-price). |
| **Own price** | Average own product price excluding shipping. |
| **Own total price** | Average own total price including shipping. |
At a glance you see how far your own prices sit from the market low and how both move relative to each other over time.
## Largest price ranges
This table lists the products whose cheapest price fluctuated the most within the window:
| Column | Meaning |
| -------------- | ------------------------------------------------------------------ |
| **Trend** | Small chart of the cheapest price over the window. |
| **Spread** | Absolute difference between the highest and lowest cheapest price. |
| **Change (%)** | The same difference relative to the lowest value, as a percentage. |
| **Range** | Lowest and highest cheapest price in the window. |
The **Total price** switch changes the basis between product price excluding shipping and total price including shipping.
## Top volatile listings
This list shows the products whose cheapest price changed most often. The **Changes/day** metric estimates how frequently the cheapest price changes per day — the higher the value, the more restless the listing. The widget sits below the visible area of the tab.
## What you can do
Listings with high volatility often move faster than a manual review can follow. They are good candidates for [applying price changes automatically](/docs/en/guide/price-changes/auto-apply). Products with a large **Spread** deserve a look at your [position](/docs/en/guide/reports/positions) on those listings.
## Offers-per-listing trend
The trend shows, per day, the average number of competitor offers per listing (**Avg. competitor offers**). For each measurement, PricePirate counts the offers from other shops and averages this number across all listings that day. A rising line means more sellers compete on your listings.
## Average prices over time
This chart shows four lines, each as a daily average across all listings:
| Line | Meaning |
| ------------------------ | ---------------------------------------------------------------------------------- |
| **Cheapest price** | Average cheapest product price excluding shipping. |
| **Cheapest total price** | Average cheapest [total price including shipping](/docs/en/guide/concepts/total-price). |
| **Own price** | Average own product price excluding shipping. |
| **Own total price** | Average own total price including shipping. |
At a glance you see how far your own prices sit from the market low and how both move relative to each other over time.
## Largest price ranges
This table lists the products whose cheapest price fluctuated the most within the window:
| Column | Meaning |
| -------------- | ------------------------------------------------------------------ |
| **Trend** | Small chart of the cheapest price over the window. |
| **Spread** | Absolute difference between the highest and lowest cheapest price. |
| **Change (%)** | The same difference relative to the lowest value, as a percentage. |
| **Range** | Lowest and highest cheapest price in the window. |
The **Total price** switch changes the basis between product price excluding shipping and total price including shipping.
## Top volatile listings
This list shows the products whose cheapest price changed most often. The **Changes/day** metric estimates how frequently the cheapest price changes per day — the higher the value, the more restless the listing. The widget sits below the visible area of the tab.
## What you can do
Listings with high volatility often move faster than a manual review can follow. They are good candidates for [applying price changes automatically](/docs/en/guide/price-changes/auto-apply). Products with a large **Spread** deserve a look at your [position](/docs/en/guide/reports/positions) on those listings.