> ## Documentation Index
> Fetch the complete documentation index at: https://pricepirate.com/docs/llms.txt
> Use this file to discover all available pages before exploring further.
# Positions
> Where your offers rank and where you have price headroom or price risk.
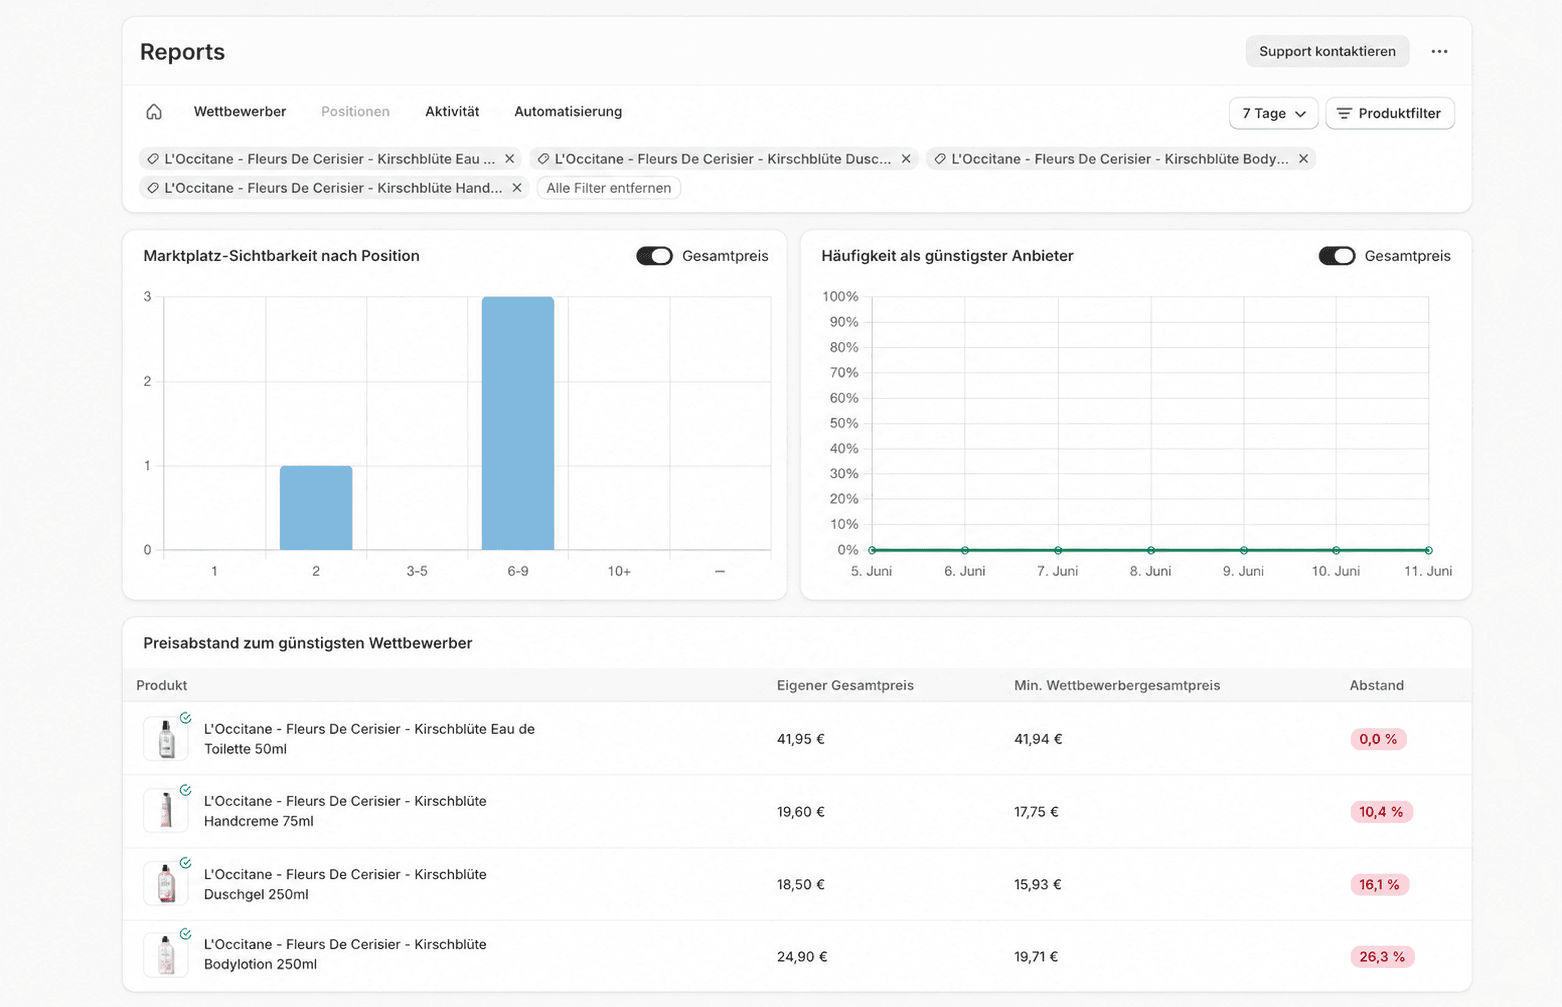
The **Positions** tab answers two questions: where do my offers rank, and where do I have room to raise the price versus the risk of being too expensive? All widgets look at your active tracked products on the selected [marketplace](/docs/en/guide/reports/overview#filter-and-time-window).
 ## Market visibility by position
The histogram shows how your products distribute across rank buckets. Each bar counts the products (**Products**) whose rank in the **last measurement** of the window fell into one of these buckets:
| Bucket | Meaning |
| ------------------------- | ---------------------------------------------------------------- |
| **1** | Your offer was the cheapest. |
| **2** | Your offer ranked second. |
| **3-5**, **6-9**, **10+** | Your offer fell within that rank range. |
| **—** | No own offer was present on the listing in the last measurement. |
The **Total price** switch changes the basis of the rank between product price excluding shipping and [total price including shipping](/docs/en/guide/concepts/total-price). Many products on the left (rank 1 and 2) mean strong visibility; a large **—** bar points to listings where you have no offer.
## Share of time as cheapest offer
The trend shows, per day, the share of your tracked products where your offer was the cheapest in the last measurement of that day. Here too the **Total price** switch toggles between product price and total price. A falling line means you are the cheapest offer on fewer products.
## Price advantages and premiums
These lists compare your price against the cheapest competitor — always based on the **total price including shipping**, regardless of the total-price switch on the widgets above. The comparison uses the value from each product's most recent measurement.
Without an active product filter, two separate lists appear:
* **Largest price advantages vs. cheapest competitor** – products where you are cheaper. There is room to raise the price.
* **Largest price premiums vs. cheapest competitor** – products where you are more expensive. There is a risk of losing sales.
As soon as you select products with the product filter, PricePirate merges both into a single **Price gap vs. cheapest competitor** list — as in the screenshot above. All lists use the same columns:
| Column | Meaning |
| ------------------------- | --------------------------------------------------------------------------------------------------------------------------------------------- |
| **Own total** | Your total price including shipping from the last measurement. |
| **Min. competitor total** | The lowest competitor total price in the same measurement. |
| **Gap** | The relative gap between both values, as a percentage. A negative value means you are cheaper; a positive value means you are more expensive. |
## What you can do
Products with a large positive **Gap** (premiums) are candidates for a review: look at their [pricing strategy](/docs/en/guide/pricing/strategies) and [settings](/docs/en/guide/pricing/settings). With large headroom, check the floor price in the strategy settings. Before changing a strategy, [test](/docs/en/guide/pricing/test) it against current listing data.
## Market visibility by position
The histogram shows how your products distribute across rank buckets. Each bar counts the products (**Products**) whose rank in the **last measurement** of the window fell into one of these buckets:
| Bucket | Meaning |
| ------------------------- | ---------------------------------------------------------------- |
| **1** | Your offer was the cheapest. |
| **2** | Your offer ranked second. |
| **3-5**, **6-9**, **10+** | Your offer fell within that rank range. |
| **—** | No own offer was present on the listing in the last measurement. |
The **Total price** switch changes the basis of the rank between product price excluding shipping and [total price including shipping](/docs/en/guide/concepts/total-price). Many products on the left (rank 1 and 2) mean strong visibility; a large **—** bar points to listings where you have no offer.
## Share of time as cheapest offer
The trend shows, per day, the share of your tracked products where your offer was the cheapest in the last measurement of that day. Here too the **Total price** switch toggles between product price and total price. A falling line means you are the cheapest offer on fewer products.
## Price advantages and premiums
These lists compare your price against the cheapest competitor — always based on the **total price including shipping**, regardless of the total-price switch on the widgets above. The comparison uses the value from each product's most recent measurement.
Without an active product filter, two separate lists appear:
* **Largest price advantages vs. cheapest competitor** – products where you are cheaper. There is room to raise the price.
* **Largest price premiums vs. cheapest competitor** – products where you are more expensive. There is a risk of losing sales.
As soon as you select products with the product filter, PricePirate merges both into a single **Price gap vs. cheapest competitor** list — as in the screenshot above. All lists use the same columns:
| Column | Meaning |
| ------------------------- | --------------------------------------------------------------------------------------------------------------------------------------------- |
| **Own total** | Your total price including shipping from the last measurement. |
| **Min. competitor total** | The lowest competitor total price in the same measurement. |
| **Gap** | The relative gap between both values, as a percentage. A negative value means you are cheaper; a positive value means you are more expensive. |
## What you can do
Products with a large positive **Gap** (premiums) are candidates for a review: look at their [pricing strategy](/docs/en/guide/pricing/strategies) and [settings](/docs/en/guide/pricing/settings). With large headroom, check the floor price in the strategy settings. Before changing a strategy, [test](/docs/en/guide/pricing/test) it against current listing data.