
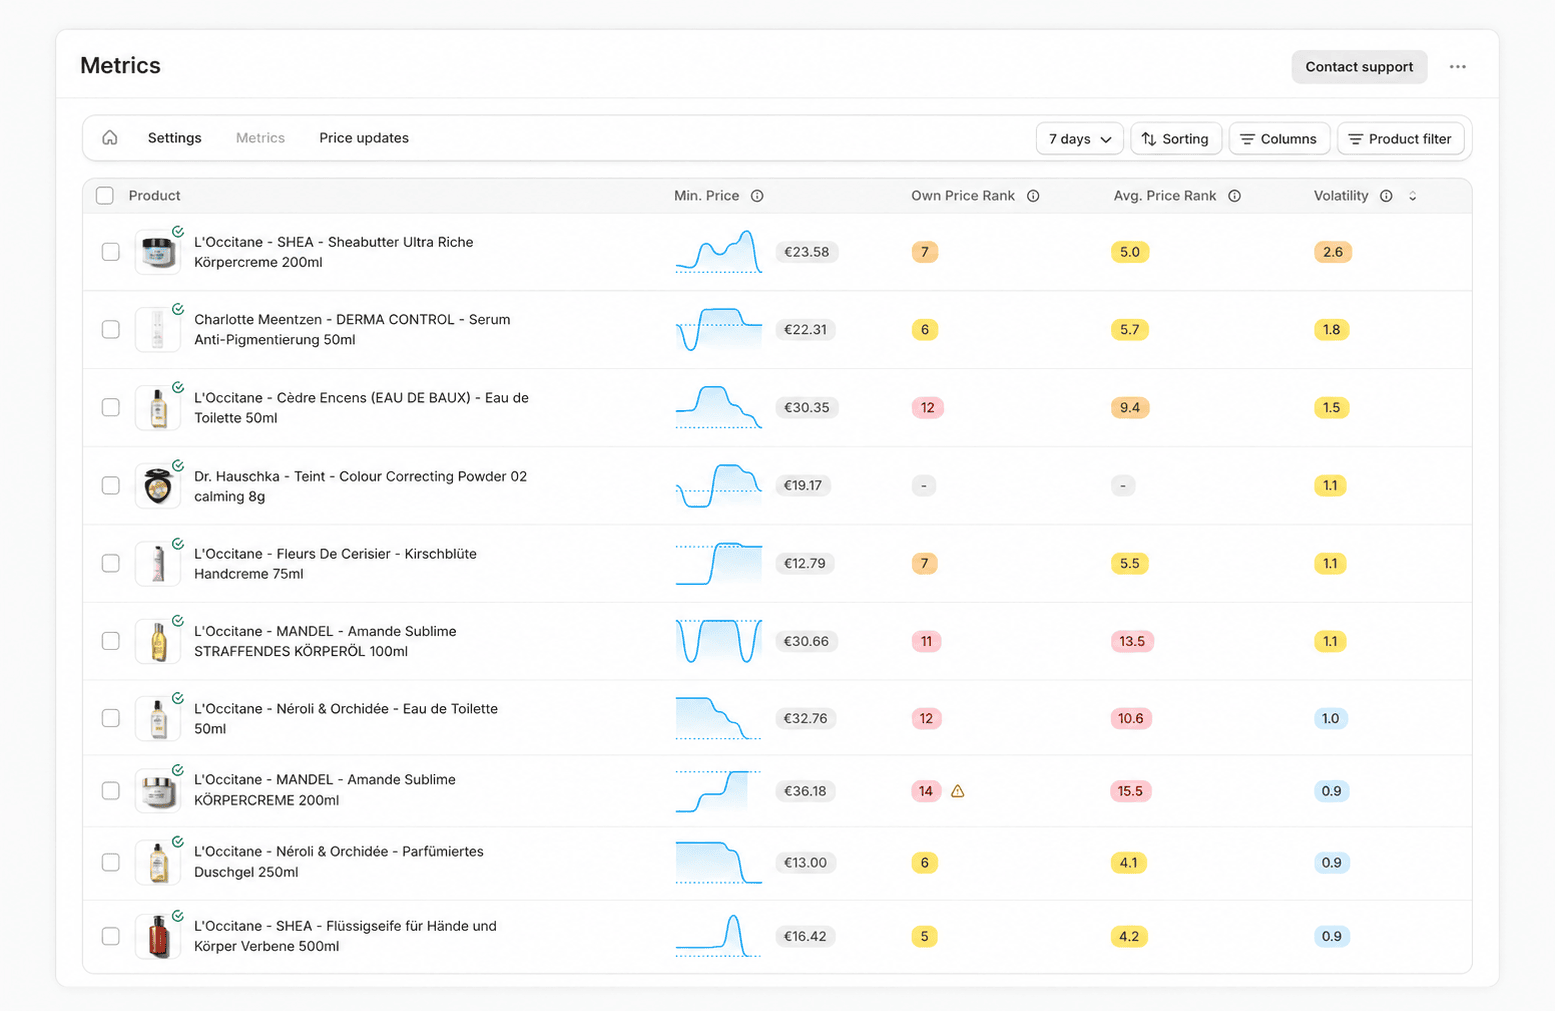
The “Metrics” tab with the default columns
Filters and controls
The header of the Metrics tab controls which data the table shows. Every control takes effect on the whole table immediately. Time window switches between 7 days, 14 days, and 30 days. The default is 7 days. All averages, shares, sparklines, and the volatility respect this window. Marketplace appears only when more than one marketplace is configured. The default is the marketplace you set for price changes in the settings. Read more under Markets in Settings. Sorting opens a menu with Sort by (column) and Order (Ascending or Descending). The default is Avg. Own Price Rank ascending. Clicking a column header also sorts by that column. Columns shows or hides individual metric columns. Only Min. Price without Shipping, Own Price Rank, Avg. Own Price Rank, and Price Volatility are visible by default; show any other column here. Product filter restricts the table to selected products or a collection. Active filters appear as removable chips above the table, along with a button that removes all filters at once.The columns
Each row stands for a tracked product. The four price columns also show a sparkline with the trend over the selected window; the value next to it is a chip that opens the detail view at the matching chart. “Current” always means the most recent measurement in the window, while average values are averaged across all measurements in the window.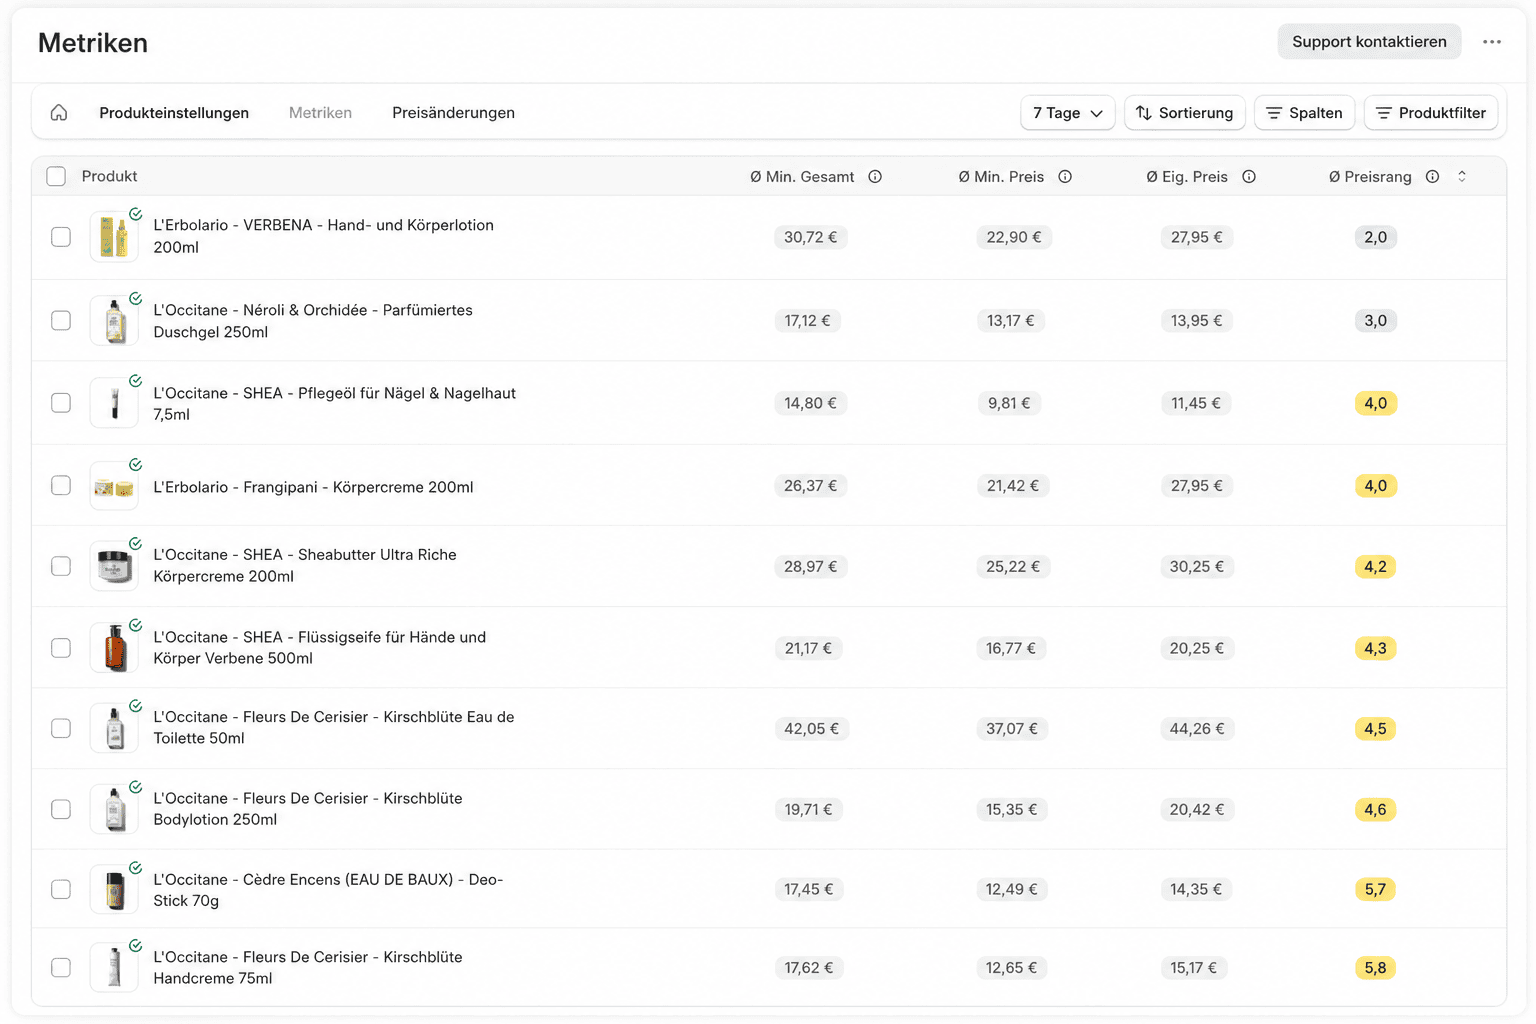
The table with additional price columns shown
The columns without shipping show the plain product price, the total columns show the total price including shipping. Compare both when shipping matters on the marketplace.
The colored badges signal the situation at a glance from green (good) to red (critical): lower ranks and higher cheapest shares are better. Price Volatility has no good-or-bad color – it only shows how restless the cheapest price of the listing is. A - means there is no data for this product and window, for example because there is no own offer or no measurement yet. When the most recent measurement is more than a day old, a warning icon appears next to Own Price Rank and Own Total Rank indicating that the data might be outdated.
Persistently high or rising ranks are a signal to review the product’s pricing strategy and its minimum price. High price volatility marks listings with a lot of price movement – good candidates for more synchronizations and for auto-applying price changes. When a pattern shows across many products, look at it for the whole marketplace through the reports.