
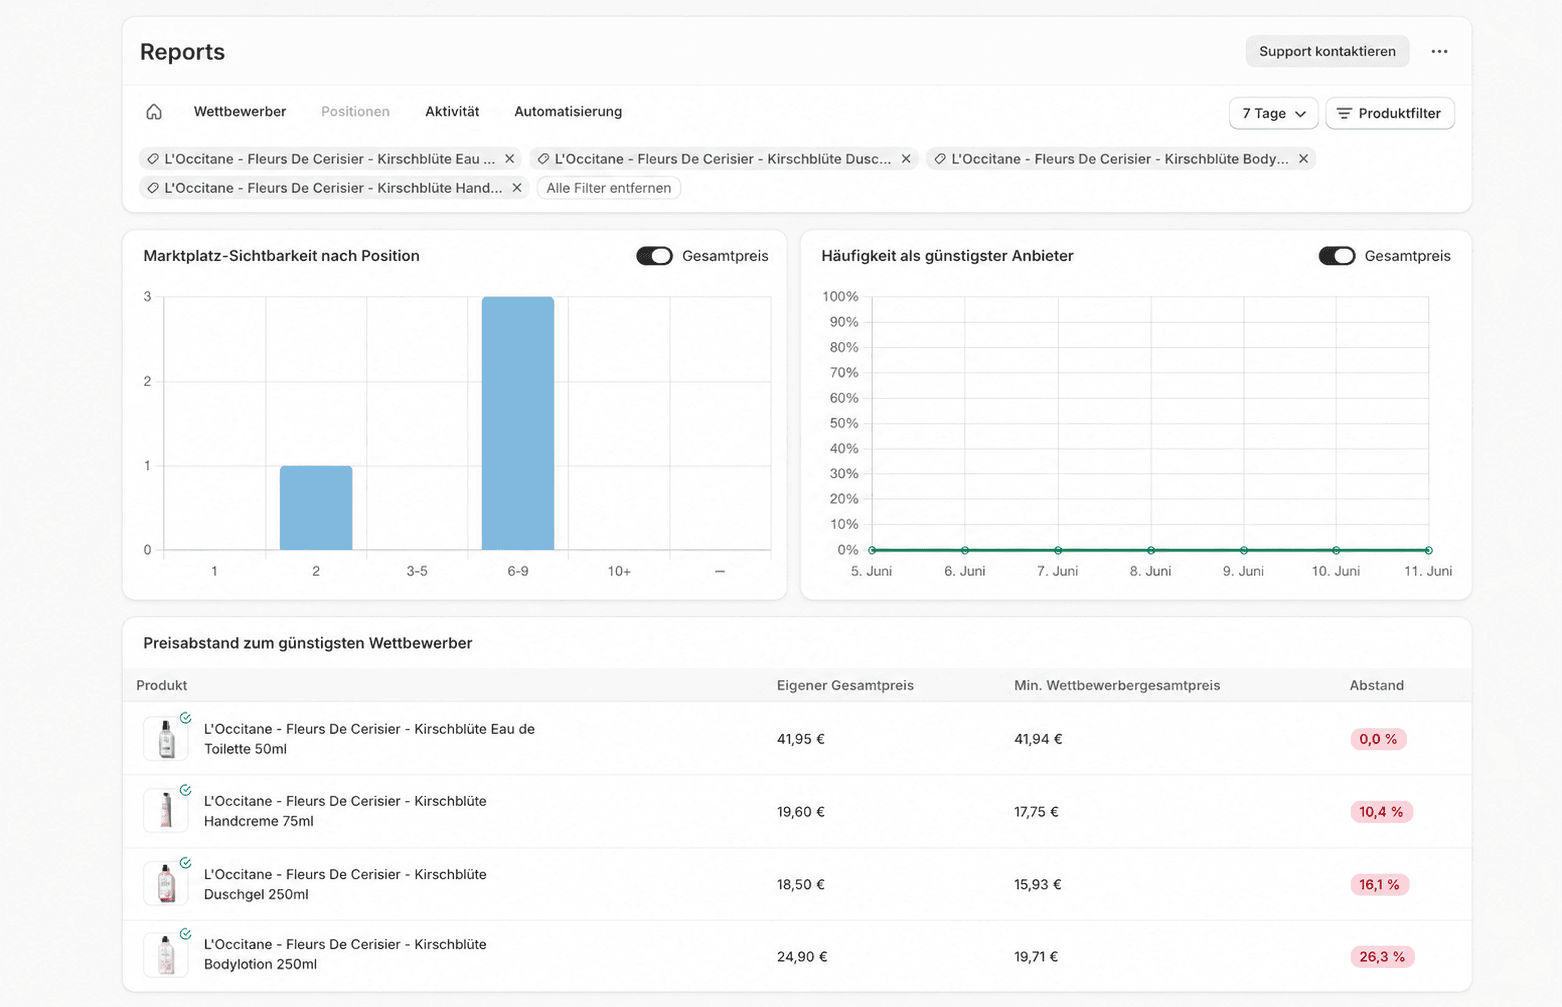
The Positions tab, here filtered to four products — which is why the combined list 'Price gap vs. cheapest competitor' appears
Market visibility by position
The histogram shows how your products distribute across rank buckets. Each bar counts the products (Products) whose rank in the last measurement of the window fell into one of these buckets:
The Total price switch changes the basis of the rank between product price excluding shipping and total price including shipping. Many products on the left (rank 1 and 2) mean strong visibility; a large — bar points to listings where you have no offer.
Share of time as cheapest offer
The trend shows, per day, the share of your tracked products where your offer was the cheapest in the last measurement of that day. Here too the Total price switch toggles between product price and total price. A falling line means you are the cheapest offer on fewer products.Price advantages and premiums
These lists compare your price against the cheapest competitor — always based on the total price including shipping, regardless of the total-price switch on the widgets above. The comparison uses the value from each product’s most recent measurement. Without an active product filter, two separate lists appear:- Largest price advantages vs. cheapest competitor – products where you are cheaper. There is room to raise the price.
- Largest price premiums vs. cheapest competitor – products where you are more expensive. There is a risk of losing sales.