
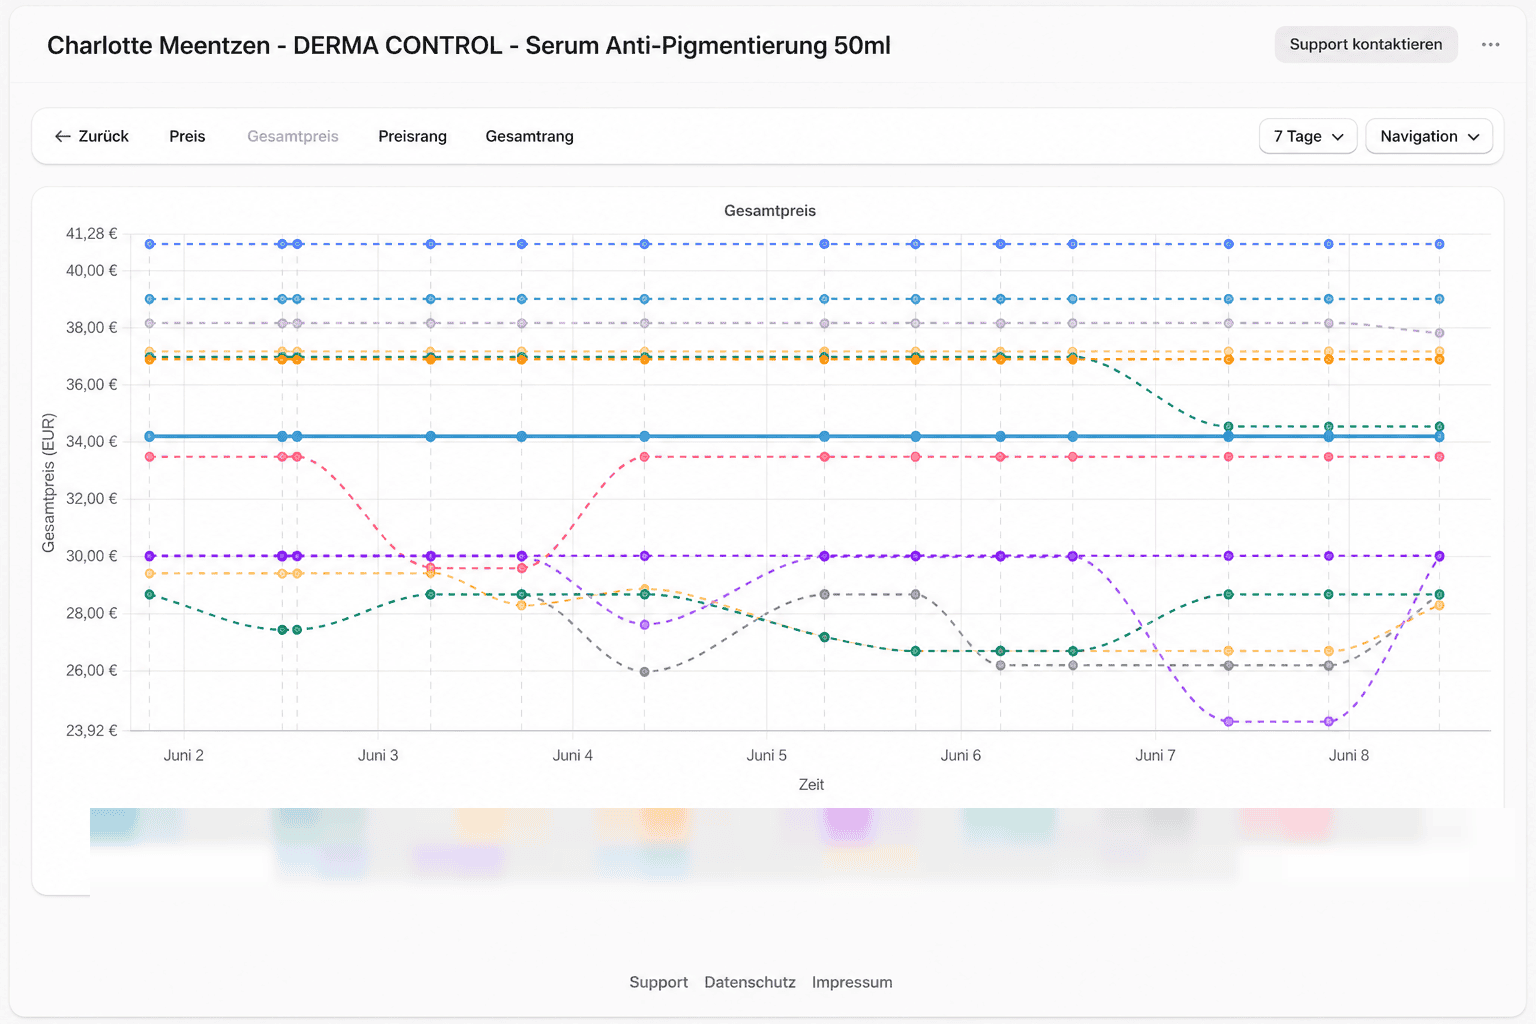
The detail view with a total price chart and vendor legend
Chart views
Four buttons above the chart switch between the views. Each line stands for a vendor; your own offer is highlighted (a solid, thicker line) and comes first in the legend, while competitors appear as dashed lines.- Price – each vendor’s product price without shipping over time.
- Total price – each vendor’s total price including shipping.
- Price rank – the resulting rank by product price.
- Total rank – the rank by total price including shipping. This view is the default.
Legend and vendors
The legend below the chart lists every vendor measured on the listing within the window. Your own shop is highlighted by color. Clicking an entry isolates that vendor and hides the others; clicking again shows all lines again.The number of offers does not necessarily equal the number of different vendors, as vendors can have multiple offers. In the rank, each vendor counts only once.
Controls
To the right above the chart you adjust the view:- Time window switches between 7 days, 14 days, and 30 days; the default is 7 days.
- Marketplace appears only when more than one marketplace is configured – the same rule as for the table filters.
- Navigation moves to the product settings, the price changes, or the reports for this product, and opens the listing on the marketplace through View listing.
When no data is shown
Instead of the chart, a message appears depending on the situation:- Not connected to a listing – connect a listing first so that measurements can be created. Read more under Connect listings.
- No offers found for this period – check that the listing exists and price monitoring is enabled. Measurements are created once the synchronizations run.