
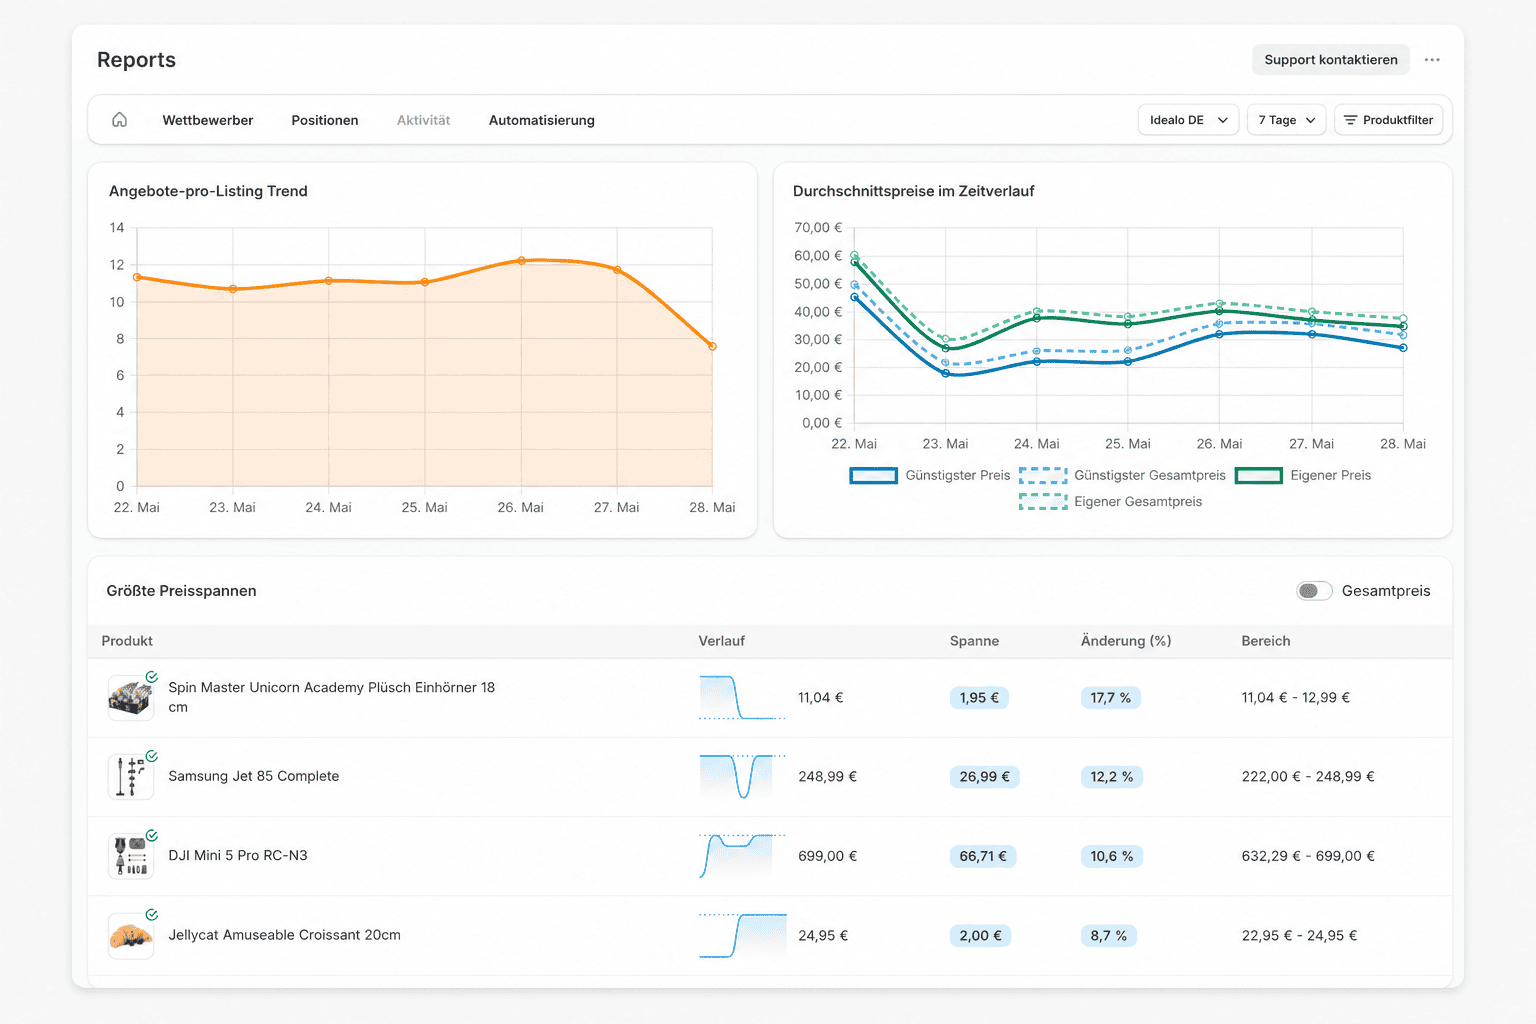
The Activity tab with the offers trend, average prices, and the 'Largest price ranges' list
Offers-per-listing trend
The trend shows, per day, the average number of competitor offers per listing (Avg. competitor offers). For each measurement, PricePirate counts the offers from other shops and averages this number across all listings that day. A rising line means more sellers compete on your listings.Average prices over time
This chart shows four lines, each as a daily average across all listings:
At a glance you see how far your own prices sit from the market low and how both move relative to each other over time.
Largest price ranges
This table lists the products whose cheapest price fluctuated the most within the window:
The Total price switch changes the basis between product price excluding shipping and total price including shipping.