
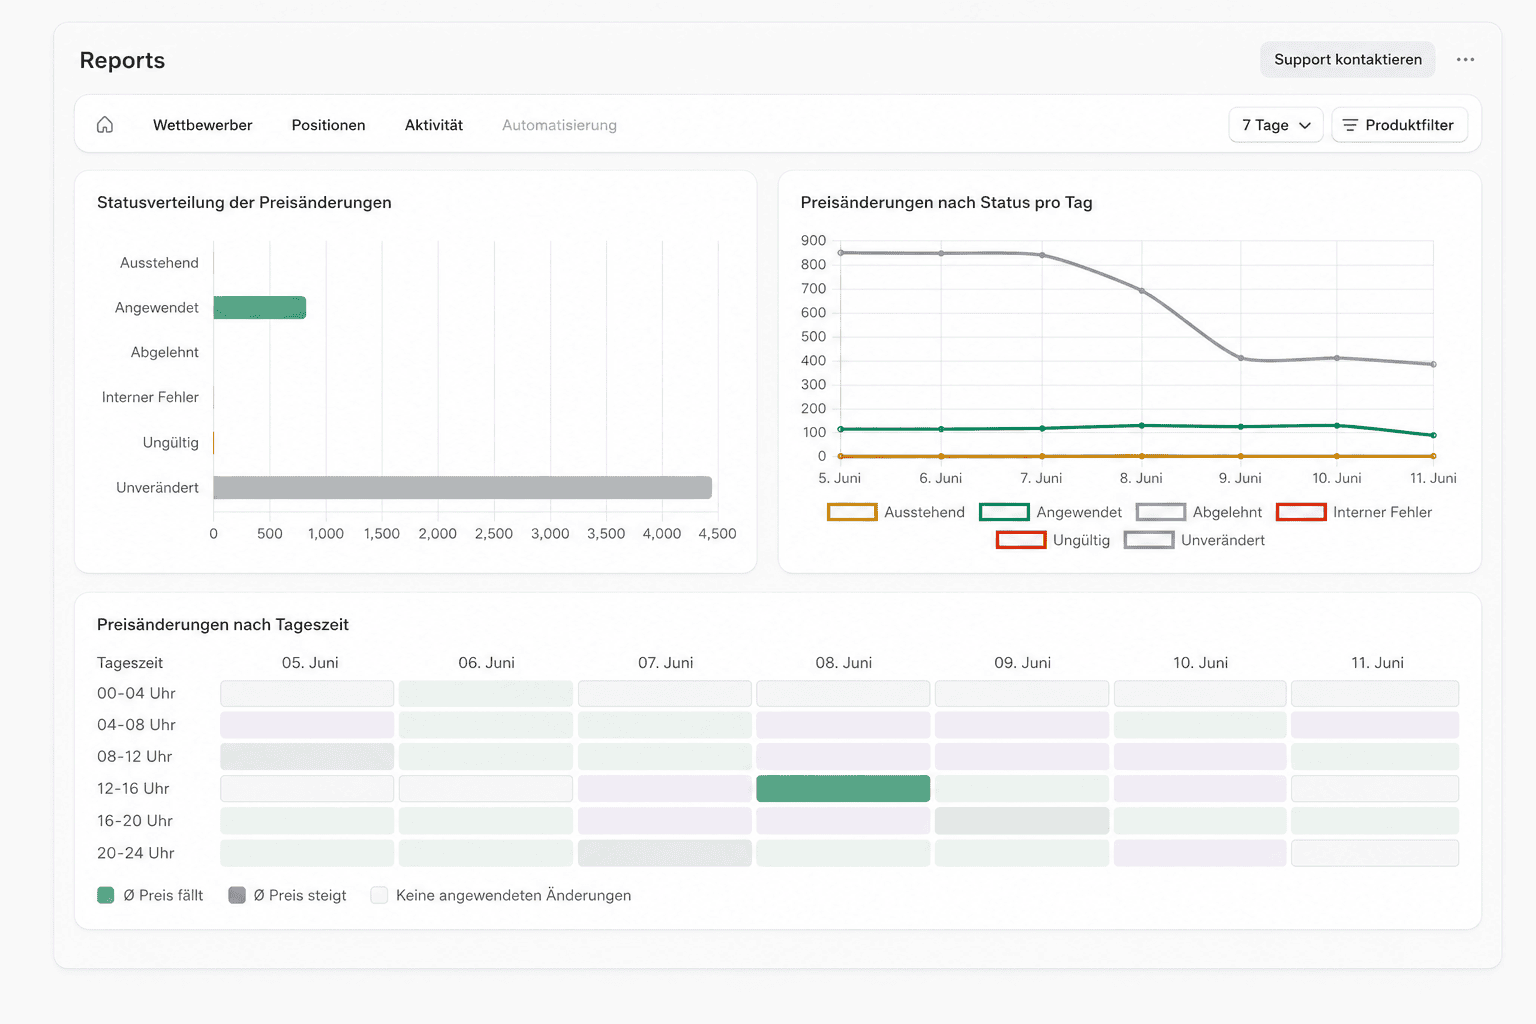
The Automation tab with the status distribution, the per-day status trend, and the time-of-day heatmap
Price change status distribution
The chart counts price changes by status within the window. Each price change carries exactly one of these six statuses:
A pending change that gets replaced by a newer one no longer counts. To learn how to review pending changes and have them applied automatically, see Review price changes and Apply automatically.
Price changes by status per day
The same set of statuses, but as a daily trend: each line shows how many price changes fell into each status on a given day. A growing pile of Pending points to a backlog in the review queue — a hint to check automatic application.Price changes by time of day
The heatmap plots days (columns) against 4-hour time windows (rows, 00-04 h to 20-24 h). Only applied changes are counted. The color of a cell shows the average direction of the price changes in that window:- Green – Avg. price down: the applied changes lowered the price on average.
- Purple – Avg. price up: the applied changes raised the price on average.
- Neutral – No applied changes: no change was applied in that window.